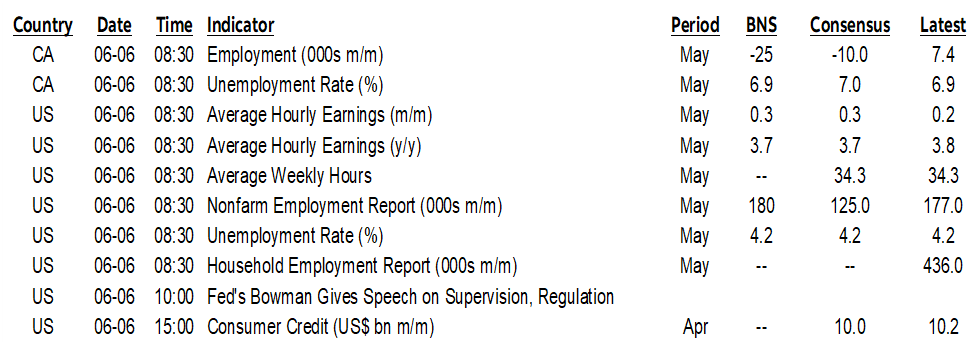
ON DECK FOR FRIDAY, JUNE 6
KEY POINTS:
- Global markets await nonfarm, Canadian markets await local jobs
- Nonfarm payrolls preview
- Canadian jobs preview
- RBI shocks with 50bps cut
- Eurozone GDP revised up with soft drivers
- Russian central bank delivers expected 100bps of easing
It’s spin the wheel time, folks! Global markets await nonfarm payrolls as Canadian markets face the added twist of a local jobs report. Global asset classes are behaving about as one would expect ahead of it all with few material changes that could spin on a dime.
Other overnight developments were light. There was a surprise 50bps rate cut by the RBI with 25bps expected but an indication that leans toward a neutral bias now. Russia’s central bank cut by the expected 100bps moments ago. Eurozone Q1 GDP was revised up to 0.6% q/q SA nonannualized which was double the initial estimate, but it was soft quality in terms of details (low regional breadth, temporary tariff front-running effects, consumption revised lower).
US nonfarm payrolls and Canadian jobs arrive at the same time for the month of May. With fingers firmly crossed, I expect the US headline to be more resilient than the distorted Canadian one but the high statistical noise and quirks in both reports always requires caution. Details will matter for both, but especially Canada.
CANADIAN JOBS PREVIEW
The May Labour Force Survey from Statistics Canada arrives at 8:30amET. Here is an outline of where the collective views stand and what I think could be the drivers.
Median consensus: -10k
Average consensus: -9.5k (ie: no skewness)
Scotia: -25k
Range: -40k to +37k (most are negative)
Std dev: 18k
95% confidence interval: +/- 57k
UR: 7.0% consensus / 6.9% Scotia (6.9% prior)
Whisper: N/A in Canada
Drivers:
You will probably have to quickly look past the headline reading that is expected to be dragged lower by a reversal of temporary election hiring. 37k public administration workers were hired in April as two of the four advance polling days before the April 28th election fell in the LFS reference week. Public administration jobs commonly fall by 20–40k in the month following the last six elections before this one and this one had more hiring than ever (chart 1).

Beyond potential sticker shock are several other arguments. Youth employment may be a drag given weak summer job postings and the distortions to the summer job market that are due to very high numbers of temporary residents coming into Canada in recent years (chart 2).

Further, SA factors will probably subtract from hiring again. SA factors for like months of May have been low in recent years compared to history (chart 3). Each of January to April this year also had the lowest SA factors on record compared to like months in history. I don’t trust the SA factors and will offer alternative scenarios as usual, as I think Statcan is merely going with a recency bias when calculating SA factors that isn’t clearly suitable to today’s conditions versus recent years that were distorted by the pandemic. This issue matters a lot; Statcan says 52k jobs were created so far this year up to April, but going with average SA factors for each month instead of historic lows would more than triple that tally.

US NONFARM PAYROLLS PREVIEW
The May establishment (nonfarm) and household survey readings on the US job market arrive at 8:30amET. Here is an outline of collective views and what I think could be the drivers.
Median consensus: 126k
Average consensus: 132k (ie: slight skewness higher)
Scotia: 180k
Range: 75k to 190k (most are negative)
Std dev: 22k
95% confidence interval: +/- 136k
UR: 4.2% consensus / 4.2% Scotia (4.2% prior)
Whisper: 110k
Drivers:
As for tariff effects, be careful. Services are much less affected than manufacturing and services account for 71% of payrolls. Manufacturing is just 8%. Further, May could still have had some tariff front-running effects on sales and support in affected sectors including the number of workers as inventories and supply chains take time to adjust. Services like retail probably saw minimal price changes in the May reference week (household survey ) and reference period (nonfarm) but the price hikes are now starting to come through and yet it’s in the context of strong income gains that could still keep consumers spending and hiring resilient.
May is normally a seasonal up-month for hiring and comes on the heels of little evidence of a weather distortion to the April base effect that if anything slightly depressed April’s reading.
SA factors are expected to overstate headline payrolls as the SA factor for the past five months of May have all been the highest in history compared to like months of May (chart 4).

Since payrolls count jobs instead of job holders, the climate of economic uncertainty may continue to motivate double counting of more positions as the number of multiple job holders trends higher.
US economic growth appears to be resilient and is highly correlated with employment growth over time.
We’re waiting for the shoe to drop on federal government employees in the payrolls report given the contested DOGE firings, but state and local government hiring could easily continue to be offsetting.
A bigger risk may be when layoffs outside of government begin to show up in the data but they may not yet be large enough to sink payrolls. I might have gone higher if not for this consideration.
Strike effects on payrolls are likely to be minor given only 7k workers on strike in April.
I’ve had several accounts ask whether this week’s US labour readings impact my estimate. I don't see a compelling reason to change it. ADP throws a lot of head fakes and is too heavily slanted toward larger employers to be useful. Other readings seem mixed and have weak track records at lining up with nonfarm. JOLTS openings were decent, ISM-employment readings netted out ok, and Challenger layoffs has seasonality issues but those numbers came off and it's too uncertain how to distribute the layoffs over time anyway. But none of them are great at predicting nonfarm's unique methodology including double counting issues, SA quirks etc.
In any event, there are very wide confidence bands around US payrolls estimates and I always put emphasis upon this. I guess my #1 ranking for nonfarm payrolls indicates that I’ve been better at playing within the wide bands than others over time, but on any one individual reading there is high uncertainty at all times. Nonfarm’s 90% confidence interval is +/-136k. Given this noise factor, I often feel that markets grossly overstate the significance of misses in the tens of thousands in either direction.
But will the numbers on either side of the border affect the BoC and Fed calls? Not in my opinion. I think they both want considerable amounts of data across various readings and particularly a series of inflation reports while recognizing that the reports have reliability issues.

DISCLAIMER
This report has been prepared by Scotiabank Economics as a resource for the clients of Scotiabank. Opinions, estimates and projections contained herein are our own as of the date hereof and are subject to change without notice. The information and opinions contained herein have been compiled or arrived at from sources believed reliable but no representation or warranty, express or implied, is made as to their accuracy or completeness. Neither Scotiabank nor any of its officers, directors, partners, employees or affiliates accepts any liability whatsoever for any direct or consequential loss arising from any use of this report or its contents.
These reports are provided to you for informational purposes only. This report is not, and is not constructed as, an offer to sell or solicitation of any offer to buy any financial instrument, nor shall this report be construed as an opinion as to whether you should enter into any swap or trading strategy involving a swap or any other transaction. The information contained in this report is not intended to be, and does not constitute, a recommendation of a swap or trading strategy involving a swap within the meaning of U.S. Commodity Futures Trading Commission Regulation 23.434 and Appendix A thereto. This material is not intended to be individually tailored to your needs or characteristics and should not be viewed as a “call to action” or suggestion that you enter into a swap or trading strategy involving a swap or any other transaction. Scotiabank may engage in transactions in a manner inconsistent with the views discussed this report and may have positions, or be in the process of acquiring or disposing of positions, referred to in this report.
Scotiabank, its affiliates and any of their respective officers, directors and employees may from time to time take positions in currencies, act as managers, co-managers or underwriters of a public offering or act as principals or agents, deal in, own or act as market makers or advisors, brokers or commercial and/or investment bankers in relation to securities or related derivatives. As a result of these actions, Scotiabank may receive remuneration. All Scotiabank products and services are subject to the terms of applicable agreements and local regulations. Officers, directors and employees of Scotiabank and its affiliates may serve as directors of corporations.
Any securities discussed in this report may not be suitable for all investors. Scotiabank recommends that investors independently evaluate any issuer and security discussed in this report, and consult with any advisors they deem necessary prior to making any investment.
This report and all information, opinions and conclusions contained in it are protected by copyright. This information may not be reproduced without the prior express written consent of Scotiabank.
™ Trademark of The Bank of Nova Scotia. Used under license, where applicable.
Scotiabank, together with “Global Banking and Markets”, is a marketing name for the global corporate and investment banking and capital markets businesses of The Bank of Nova Scotia and certain of its affiliates in the countries where they operate, including; Scotiabank Europe plc; Scotiabank (Ireland) Designated Activity Company; Scotiabank Inverlat S.A., Institución de Banca Múltiple, Grupo Financiero Scotiabank Inverlat, Scotia Inverlat Casa de Bolsa, S.A. de C.V., Grupo Financiero Scotiabank Inverlat, Scotia Inverlat Derivados S.A. de C.V. – all members of the Scotiabank group and authorized users of the Scotiabank mark. The Bank of Nova Scotia is incorporated in Canada with limited liability and is authorised and regulated by the Office of the Superintendent of Financial Institutions Canada. The Bank of Nova Scotia is authorized by the UK Prudential Regulation Authority and is subject to regulation by the UK Financial Conduct Authority and limited regulation by the UK Prudential Regulation Authority. Details about the extent of The Bank of Nova Scotia's regulation by the UK Prudential Regulation Authority are available from us on request. Scotiabank Europe plc is authorized by the UK Prudential Regulation Authority and regulated by the UK Financial Conduct Authority and the UK Prudential Regulation Authority.
Scotiabank Inverlat, S.A., Scotia Inverlat Casa de Bolsa, S.A. de C.V, Grupo Financiero Scotiabank Inverlat, and Scotia Inverlat Derivados, S.A. de C.V., are each authorized and regulated by the Mexican financial authorities.
Not all products and services are offered in all jurisdictions. Services described are available in jurisdictions where permitted by law.