- Excluding election workers, jobs were up by 41k in May
- It was all full-time, all payrolls, with significant sectoral and regional breadth
- Wage growth hit a seven month high
- Hours worked were flat, restrained by weather, but mildly supportive of Q2 GDP
- Youth employment surprised flat, females 25+ drove the gain
- SA factors did not materially distort this report, for a change
- The BoC will breathe a sigh of relief, but is more focused on inflation
- Canadian jobs, m/m 000s / UR %, SA, May:
- Actual: 8.8 / 7.0
- Scotia: -25 / 6.9
- Consensus: -10 / 7.0
- Prior: 7.4 / 6.9
I’m shocked that Canada’s job market was so strong last month. That’s not just in reference to the headline reading as the details were strong across the board.
First, almost everyone was expecting a negative and we got a modest gain of 8,800 jobs.
Second, the gain was despite getting the expected drop in public administration jobs that largely reflected the unwinding of the election effect from the prior month. Public admin jobs fell by 32.2k which is consistent with the past half dozen elections (chart 1).
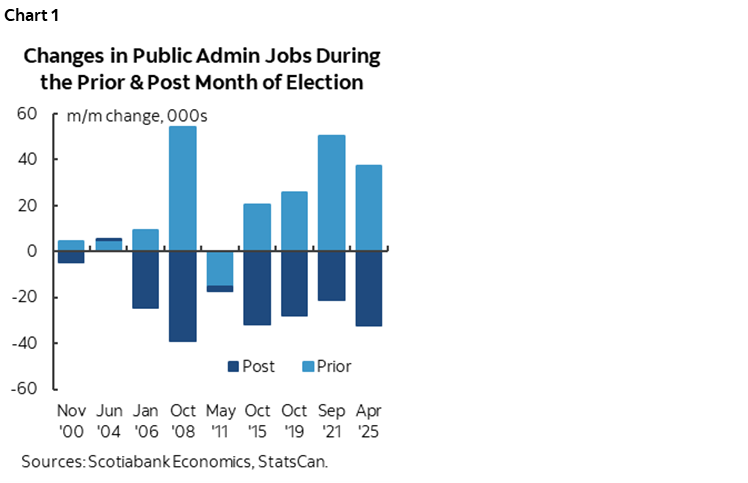
So, take that out, and underlying job growth was up by 41k. That’s a strong reading.
As chart 2 shows, there was significant regional breadth to the gain.

All of the gain was in full-time jobs (+57.7k) as part-time jobs fell by 48.8k).
All of the job growth was in payrolls that were up by 39.3k entirely due to private payroll positions (60.6k) as public sector payroll jobs fell by 21.3k due to the election effect.
Self-employed positions fell by 30.4k. That’s not great, and there are lots of high quality and important self-employed jobs, but I usually fade big swings in this number because it’s soft data, reliant on self-reporting and with a bigger lifestyle component than payroll positions.
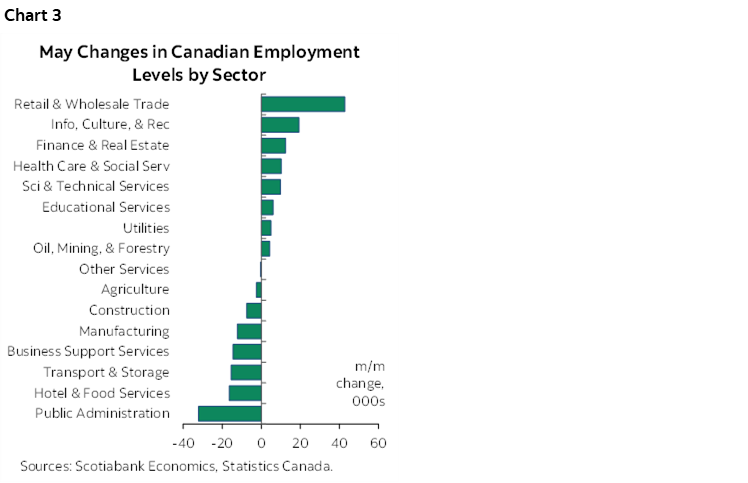
By sector, goods lost 13k jobs, services were up 21.8k. Services excluding the election effect on public administration jobs posted a 54,000 job gain.
Who did that? See chart 3. Wholesale and retail jobs were up 42.8k. If no one’s spending, then someone forgot to tell that sector. Finance, insurance and real estate added jobs (12.4k) and so did several others that added about 10–20k jobs each. There were notable decliners too.
Wages exploded. They were up by 6.9% m/m SAAR which is the strongest since October (chart 4).

Youth employment was more resilient than I had feared. Jobs for youths aged 15–24 were unchanged, but it has been a soft four months that still indicates a weak market for them.
This report was about adult women (chart 5). They gained 37k jobs, while men aged 25+ lost 28k jobs. Both were reversals of the prior month.

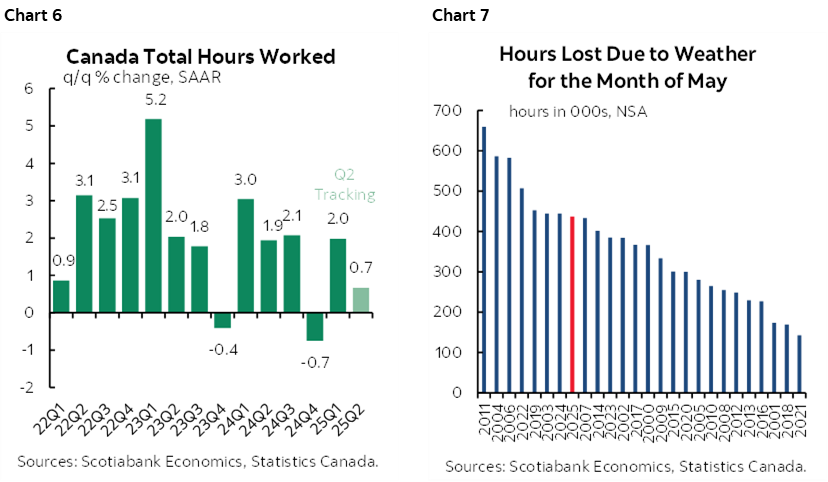
Despite the full-time job gain, hours worked were flat (-0.02% m/m SA). No change. And yet they are tracking a modest gain of 0.7% q/q SAAR in Q2 which is mildly supportive of GDP growth defined as hours worked times labour productivity (chart 6). Weather didn’t help (chart 7).
Unlike the distorted readings over January to April that were artificially depressed by cooked seasonal adjustment factors, that wasn’t the case this time. Chart 8 shows that the SA factor wasn’t a deep outlier this time, as May typically is not. Alternative scenarios for job growth at other SA factors would have still mostly generated decent job growth (chart 9).

While the unemployment rate ticked up to 7% because the labour force expanded by 35k last month and that exceeded aggregate job growth. The UR controlling for the election related loss of public admin jobs would not have risen. Further, the rise of the UR since 2022 has been mostly focused upon excessive numbers of temps (chart 10).

I think the Bank of Canada will fade these numbers. Not because they’re bad; they’re actually quite good. But because their reaction function has signalled a stronger focus upon the next two CPI reports notwithstanding how contradictory its guidance is right now.
DISCLAIMER
This report has been prepared by Scotiabank Economics as a resource for the clients of Scotiabank. Opinions, estimates and projections contained herein are our own as of the date hereof and are subject to change without notice. The information and opinions contained herein have been compiled or arrived at from sources believed reliable but no representation or warranty, express or implied, is made as to their accuracy or completeness. Neither Scotiabank nor any of its officers, directors, partners, employees or affiliates accepts any liability whatsoever for any direct or consequential loss arising from any use of this report or its contents.
These reports are provided to you for informational purposes only. This report is not, and is not constructed as, an offer to sell or solicitation of any offer to buy any financial instrument, nor shall this report be construed as an opinion as to whether you should enter into any swap or trading strategy involving a swap or any other transaction. The information contained in this report is not intended to be, and does not constitute, a recommendation of a swap or trading strategy involving a swap within the meaning of U.S. Commodity Futures Trading Commission Regulation 23.434 and Appendix A thereto. This material is not intended to be individually tailored to your needs or characteristics and should not be viewed as a “call to action” or suggestion that you enter into a swap or trading strategy involving a swap or any other transaction. Scotiabank may engage in transactions in a manner inconsistent with the views discussed this report and may have positions, or be in the process of acquiring or disposing of positions, referred to in this report.
Scotiabank, its affiliates and any of their respective officers, directors and employees may from time to time take positions in currencies, act as managers, co-managers or underwriters of a public offering or act as principals or agents, deal in, own or act as market makers or advisors, brokers or commercial and/or investment bankers in relation to securities or related derivatives. As a result of these actions, Scotiabank may receive remuneration. All Scotiabank products and services are subject to the terms of applicable agreements and local regulations. Officers, directors and employees of Scotiabank and its affiliates may serve as directors of corporations.
Any securities discussed in this report may not be suitable for all investors. Scotiabank recommends that investors independently evaluate any issuer and security discussed in this report, and consult with any advisors they deem necessary prior to making any investment.
This report and all information, opinions and conclusions contained in it are protected by copyright. This information may not be reproduced without the prior express written consent of Scotiabank.
™ Trademark of The Bank of Nova Scotia. Used under license, where applicable.
Scotiabank, together with “Global Banking and Markets”, is a marketing name for the global corporate and investment banking and capital markets businesses of The Bank of Nova Scotia and certain of its affiliates in the countries where they operate, including; Scotiabank Europe plc; Scotiabank (Ireland) Designated Activity Company; Scotiabank Inverlat S.A., Institución de Banca Múltiple, Grupo Financiero Scotiabank Inverlat, Scotia Inverlat Casa de Bolsa, S.A. de C.V., Grupo Financiero Scotiabank Inverlat, Scotia Inverlat Derivados S.A. de C.V. – all members of the Scotiabank group and authorized users of the Scotiabank mark. The Bank of Nova Scotia is incorporated in Canada with limited liability and is authorised and regulated by the Office of the Superintendent of Financial Institutions Canada. The Bank of Nova Scotia is authorized by the UK Prudential Regulation Authority and is subject to regulation by the UK Financial Conduct Authority and limited regulation by the UK Prudential Regulation Authority. Details about the extent of The Bank of Nova Scotia's regulation by the UK Prudential Regulation Authority are available from us on request. Scotiabank Europe plc is authorized by the UK Prudential Regulation Authority and regulated by the UK Financial Conduct Authority and the UK Prudential Regulation Authority.
Scotiabank Inverlat, S.A., Scotia Inverlat Casa de Bolsa, S.A. de C.V, Grupo Financiero Scotiabank Inverlat, and Scotia Inverlat Derivados, S.A. de C.V., are each authorized and regulated by the Mexican financial authorities.
Not all products and services are offered in all jurisdictions. Services described are available in jurisdictions where permitted by law.